
Body Analysis
The handful of tape measurements you enter become a body-fat estimate and a waist-risk band; the same numbers feed the nutrition and training engines. Photos are optional — nothing is computed without the measurements.
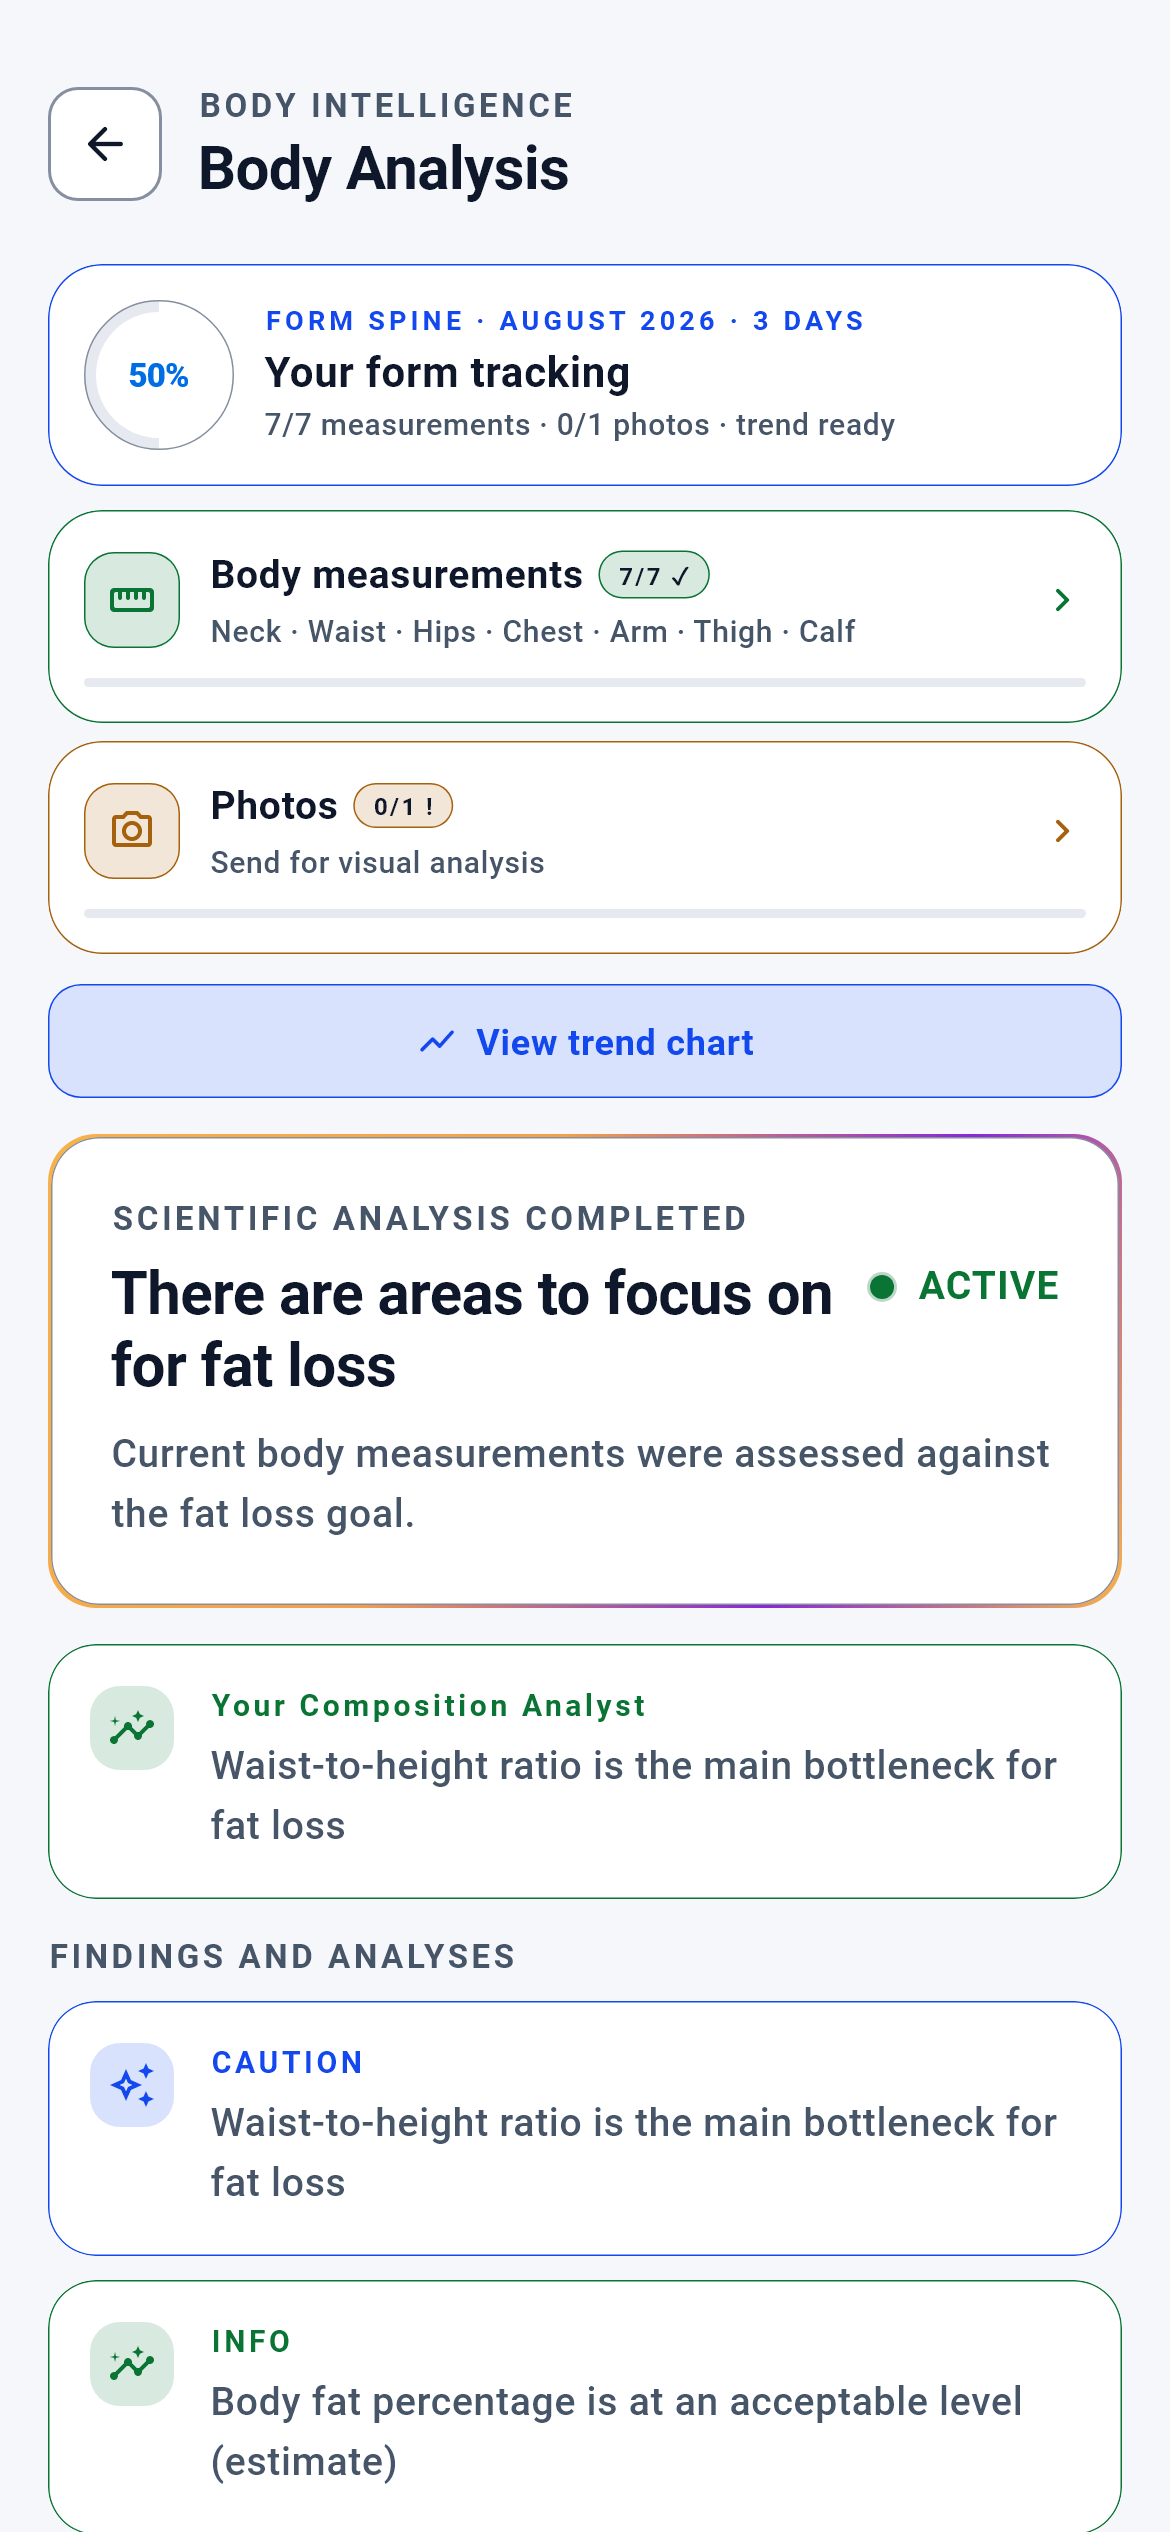
Body Analysis · 1/9
The module’s entry screen. Tapping "Body Analysis" on the Dashboard brings you here; this is where you see this month’s state at a glance.
You read the commentary and numbers derived from this month’s measurements, and start a new analysis from below if you want.
- The body measurements card → the measurement entry screen
- "See the trend chart" → 6-Month Progress
- "Digi Analysis (photo-based)" → the photo consent and upload flow
- Back → Dashboard
What is on this screen 4
Say you open the screen for the first time and a ring reading "50%" sits at the top with the line "7/7 measurements · 0/3 photos".
The measurement half of the ring fills from the seven values you entered; the photo half stays empty because of the app’s rule of NOT storing your photos.
The measurement side counts seven fields: neck, chest, waist, hips, arm, thigh, calf. The photo side looks at the monthly record’s photo fields — and nothing is ever deliberately written there. The app does not keep your body photos: the frame you choose goes to the analysis, its temporary copy is deleted and no path is written to the record. So "0/3 photos" is not a warning about something missing but the on-screen trace of the no-retention rule; that is also why the ring never rises above fifty per cent.
Do not read the ring as a completion score; the real information is the "7/7 measurements" beside it — that is what the analysis runs on.
Say the panel reads "SCIENTIFIC ANALYSIS COMPLETE — there are areas to focus on for fat loss", with a green-framed "Your composition specialist" box beneath it.
That sentence is chosen for your goal, and the single line in the box is that month’s top-ranked finding.
The commentary layer first reduces your goal to one of three contexts: fat loss and recomposition fall into "fat loss", muscle and strength into "muscle gain", everything else into "health". Then that context’s own rule list runs — in the fat-loss context the order is waist-to-height ratio, waist-circumference band, body-fat percentage, lean mass. The app does NOT write the sentence in the box; the server ranks the findings and the screen takes only the first. If no finding was produced the box is not drawn at all — inventing a sentence with nothing to say costs trust on a health surface.
To change this line you have to change your measurements; change your goal and the ranking itself changes, moving a different metric into first place.
The system calls this "goal-aware coaching".
Say under the "FINDINGS AND ANALYSES" heading there are two cards, one labelled orange "MODERATE" and one green "INFO".
The colour carries the finding’s severity: there are three tiers — info, caution and warning.
The tier comes from the rule itself rather than the author’s preference. A waist-to-height ratio above 0.50 becomes "caution", above 0.60 "warning"; both numbers are fixed thresholds taken from the central-adiposity literature. Below 0.50 the same measurement is written not as a warning at all but as "progress". The screen does not recompute these tiers — it decides nothing beyond which colour to draw.
Do not panic at an orange card: the "caution" tier is not a diagnosis but a marker of the area to work on that month.
Say the server could not be reached and you opened the screen anyway.
The screen shows neither an old report nor an approximate number; it falls to an error surface and says "try again".
All three decisions (the readiness gate, the calculation engine, the commentary layer) arrive by one route, from the server. There is deliberately NO fallback copy on the device: with the threshold table living at two addresses, one would be updated while the other stayed and the same user would read different risk on two screens. Worse, a warning quietly disappearing is more dangerous than a wrong one — you cannot notice its absence.
If you see this screen there is nothing wrong with your measurements; reopen the page once your connection recovers.
The system calls this "fail-closed" behaviour.
Behind the scenes — how the system decides 8
Body fat — which measurements, which equation
Say you measured your neck at 39.5 cm, your waist at 92 cm and your hips at 101 cm; your height is 178 cm and your weight 82 kg. The screen shows "20.5%".
That number comes from the US Navy circumference equation (Hodgdon-Beckett) and for men uses three inputs: waist minus neck, and height.
For men the equation is 495 / (1.0324 − 0.19077·log(waist−neck) + 0.15456·log(height)) − 450. For women the equation is DIFFERENT: waist and hips are added, the neck subtracted, and the coefficients are entirely different (1.29579 · 0.35004 · 0.22100). This duality is not discrimination but the equation’s own structure — body fat accumulates in different regions in the two sexes and one equation cannot measure both. If sex is unknown no result is produced at all: applying the male equation to a woman systematically UNDERestimates by four to five points, so it is not even "cautious". The number is finally clamped at both ends (between 1% and 70%), and if body mass index is below 15 or above 50 the equation is not run at all — it does not give reliable results in that range.
Three things matter for an accurate result: run the tape over the same point every time, measure at the same time of day, and do not leave the sex field empty in your profile. An empty sex field closes body fat entirely.
The system calls this the "Navy (circumference) body-fat estimate".
When an estimate is stamped "low confidence"
Say you are 64 with a body mass index of 41. Your body fat is still computed but carries less say further down the chain.
When the equation moves outside the sample it was validated on, a result is still produced but marked "low confidence".
The mark is set by one of four conditions: the number was clamped at either bound, age is below the age of majority or above 60, or body mass index fell below 18.5 or rose above 40. This flag does not appear on screen as a separate warning but it is not lost in the chain: the layer assembling the body-trait payload does not give a low-confidence body-fat value the full bonus (0.05 instead of 0.15), and if total confidence falls below the threshold the payload is sent without body fat, carrying only the trend signal.
If you are in those ranges, watch the direction rather than the number; a body fat falling month by month is still real information, its absolute value simply is not precise.
The system calls this "outside the validated range".
What photo analysis does and does NOT do
Say you uploaded photos from three angles and the result screen showed "19.9% · Lean", muscle-group bands and left–right balance lines.
Photos produce three things: a body-fat estimate, a development band per muscle group, and an asymmetry band for the upper and lower body. Nothing else.
A photo is not medical imaging and does not pretend to be. Three limits are fixed in the code. First: the result travels as a BAND rather than a decimal score — it says "core development is low", never "0.42". Second: the language model’s own confidence score is never used; the confidence is the system’s own calculation. Third and most important: on the photo-only route the confidence ceiling is 0.70 and in practice reaches at most 0.60, while opening the nutrition payload requires 0.70. So photos ALONE cannot change your calorie target; tape measurements are required for entry into numerical decisions. That is a deliberate ceiling, not a shortcoming.
Taking photos does not replace tape measurements. Do not reverse the order: measure first, then enrich with photos if you want.
The system calls this "confidence-gated routing".
Where the photo goes — the privacy route end to end
Say you picked a photo from your gallery and pressed "Start analysis".
The photo is downscaled, consent is checked, it is sent to the analysis service; the server decides accept or reject; the temporary copy is deleted from disk and the app never stores the photo.
The order is deliberate. At selection the photo is reduced to at most 1080×1920 pixels with lowered quality — outgoing data is kept minimal. The consent gate runs BEFORE sending and throws if consent is absent; the transport layer is never assembled. The device does not write the prompt text either — the server owns it and the app deliberately sends an empty string. Nor does the device decide whether the answer is an acceptance or a rejection; the verdict written by the server is read — with the thresholds on the device, a user who did not update the app would reject, under an old policy, an estimate the server accepted. On the storage side no photo path is ever written into the monthly ledger, and the temporary copy left by the picker is deleted even if the record fails.
When you withdraw your consent, what is deleted is report data; the app never touched the photos in your gallery.
The system calls these the "server-authoritative verdict" and the "no-retention rule".
Where the word "Lean" comes from — and why not from the phone
Say your blended body fat came out at 19.4% and the screen reads "Lean" in large letters.
The phone does not choose that word; the server computes it and sends it as a ready word in your language.
The classification has four bands with boundaries at 13%, 20% and 28%. For a while those three numbers and four labels were hard-coded inside the screen’s card. The problem: the thresholds rest on a scientific reference and references get updated — with the threshold on the phone, a user who does not update the app keeps living by the OLD rule: the screen still tells them "Moderate" while the new table puts them in "High". On a classification that touches health this is unacceptable. The word itself is carried in the response too, not the band name: had the device taken a band name and translated it from its own dictionary, the dictionary would still live on the phone. If no label arrives the card does NOT show the band line at all and runs no local threshold in its place.
On a result where you cannot see the band line, the number is still valid; only the classification is missing, and its absence is better than an invented one.
The system calls this "server-authoritative classification".
Why the reference table and the warning threshold use different numbers
Say a female user’s body fat came out at 33%. The reference table on the metric card reads "obese: 32% and above", yet no high-body-fat warning appears among the coaching findings.
The two numbers answer different questions: one asks "which category are you in", the other "should I write you a warning".
The table is a population classification and its source is the American Council on Exercise body-fat categories. The warning threshold is a risk boundary and its source is body-fat-defined obesity — 25% for men, 35% for women. In men the two systems meet at the same number; in women they diverge. Closing that divergence by "equalising" would mean picking one of the two numbers without a source, and in a calculation engine scientific method is not chosen by taste. What was closed was a THIRD threshold: for a while the warning token on the server read the classification number (32%) for women, meaning an output labelled "warning" was consulting the wrong table. It is now aligned, and the alignment is locked by a cross-language guard.
The category on your card and the warning in your findings not appearing together is not an inconsistency; they are two sourced answers to two different questions.
Collapsing the two into one number is called "category conflation".
Where the numbers go after the analysis
Say this month’s analysis completed and your nutrition plan was rebuilt the next day.
The analysis result is split into two payloads and goes to two engines: the nutrition payload and the training payload.
The split is not arbitrary but confidence-gated. Below 0.50 total confidence no payload is produced at all — spreading an unsupported number across two engines would multiply the error. Between 0.50 and 0.70 the nutrition payload carries only the trend signal; body fat and lean mass are NOT included. Only at 0.70 and above does the nutrition payload fill completely: body fat, lean mass, waist and hip measurements, waist-to-height ratio, central-adiposity risk. The training payload is separate and carries different things: left–right asymmetry scores, a regional priority map and the composition trend. If measurements are older than 90 days the regional priority is emptied and training confidence is damped by a factor of 0.7.
The invisible benefit of measuring regularly is here: the same numbers feed both your calorie target and which muscle group gets priority.
The system calls this "body trait routing".
What each engine loses if you enter no measurements
Say you have entered no tape measurements at all but actively use the training and nutrition modules.
Both modules keep working — but the nutrition engine builds your calorie target with a coarser equation and the training engine never sees regional priority.
On the nutrition side basal metabolism can be computed two ways. With lean mass known, the Cunningham equation is used (500 + 22 × lean mass); it works within ±5% error in people with high muscle or high body fat. Without lean mass it falls back to the classic equation, which looks at total weight — it cannot distinguish two different body compositions at the same weight and the error band rises to 10–15%. On the training side the asymmetry scores and the muscle-group priority map stay entirely empty; the plan cannot make a balance correction specific to you. The analysis does not run on its own screen either: without waist, hip and neck measurements the readiness gate never calls the engine.
Seven measurements taken once a month in five minutes feed three modules at once. Skip them and the system does not punish you; it simply builds your plan knowing less.
What your data is for 8
Waist, hip and neck circumference (the three required measurements)
If you provide it The analysis runs: body fat, lean mass, waist-to-height ratio, waist-to-hip ratio and the waist risk band are computed, and in the same pass they go to the nutrition and training engines too.
If you skip it The readiness gate closes and the engine is never called. Instead of a report the screen draws the list of what is missing, naming the fields. No invented default measurement is EVER used.
When the measurements were taken (the date stamp)
If you provide it Newer than thirty days and the analysis runs fully. After the twenty-fifth day a "renew soon" warning appears but the analysis does not stop.
If you skip it Even with measurements entered, freshness cannot be verified and the gate closes — an undated measurement is a number belonging to an unknown body. Beyond thirty days the analysis also stops and even the photo section is hidden.
Sex in your profile
If you provide it The body-fat equation and three separate risk thresholds (waist circumference, waist-to-hip ratio, body fat) select the correct branch.
If you skip it Body fat is NOT computed at all and no risk band is produced; a "not enough data" line appears in their place among the findings. Treating an unknown as "male" would not be a default but a health judgement made on your behalf, and its direction is not innocent: it silences the waist-to-hip warning while writing an unwarranted one for body fat.
Your goal in the profile (fat loss / muscle / health)
If you provide it The order of findings and the priority of metric cards is built for your goal: on fat loss the waist-to-height ratio and body fat come forward, on a muscle goal lean mass and the chest-to-waist difference take the lead.
If you skip it The analysis does not stop; the goal is taken as "healthy living" and that assumption is carried to you as a notice — it is not chosen silently. In the health context the ranking is built around central-adiposity signals.
Chest, arm, thigh and calf (the four optional measurements)
If you provide it The ratio cards open (chest minus waist, arm-to-calf ratio) and the body-trait payload’s confidence rises by 0.05 for each — so the payload is more likely to reach the engines.
If you skip it The analysis still runs and body fat is still computed; only the ratio cards are not drawn and the confidence stays 0.10 lower. On a muscle goal a "not enough data" finding is written in place of the chest-to-waist difference.
Consent for photo analysis
If you provide it The photo flow opens; the result is blended with your tape measurements and a regional-development and left–right balance layer is added.
If you skip it The photo pipeline is never assembled — it is stopped before the request is built and you are directed to settings. The tape-based analysis is unaffected and works exactly as before.
Photos from three angles (front, side, back)
If you provide it The photo side takes its highest weight in the blend (0.45) and system confidence can rise to its 0.90 ceiling.
If you skip it Each missing angle lowers the photo’s weight by 0.05 and system confidence by 0.05. With no photos at all the result rests on the tape alone and the confidence ceiling stays at 0.80 — a legitimate mode of operation, not a fault.
Repeating monthly (one record per month)
If you provide it The trend screen fills; after two measurements the direction commentary begins, and once six months are in the chart is complete. The coaching sentence also refreshes each month.
If you skip it A skipped month does not appear in the chart at all (it is not filled with a zero) and with one measurement the commentary panel is not drawn. With no records the trend screen shows the "Not enough data yet" surface.